

Kettera Strategies Heat Map - May 2024
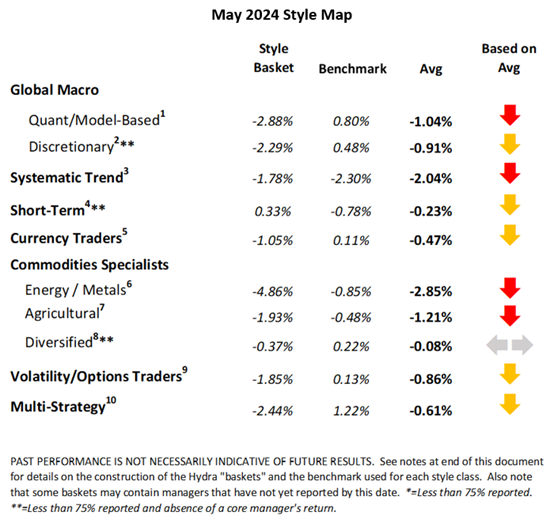
The Style Heat Map below offers a snapshot for the month on all categories of strategies. For the month of May, the following summaries highlight six of the 10 style categories that we track.
Quantitative Global Macro Programs
It appears that nearly all types of quantitative (or “model based”) macro programs had a difficult month. Managers reliant on fundamental econometric data as well as those focused on price-based models struggled during the month – although the former seemed to struggle more than the latter. Most of the setbacks were inflicted in the first week of the month – across several sectors. Positions in FX rates may have performed the worst - with losses from long US Dollar exposures vs. “commodity currencies” (MXN, Aussie, NZL, CAD) and G5 units (British Pound, Euro). The energy sub-sector also posed some challenges. Long positions in crude oil and derivative products, not to mention short exposures in US natural gas, generated some painful losses. Most macro managers’ performance in fixed income (short-term rates and long-term bonds) was choppy and generally difficult throughout the month. Trading in equity indices, on the other hand, seemed generally mixed - and close to net flat - across most of the quant macro programs we track.
Systematic Trend Programs
May was also a negative month overall for most systematic trend managers. Both medium-term and longer-term holding programs felt the pain, although strategies with medium term holding periods tended to fare a bit better (or less bad). Returns generally ranged from -0.5% to -5.0%. The few winning exposures included long equities (US, Europe, Asia) and long precious metals (silver, gold), with some small gains from long base metals (copper, nickel, aluminum). Losses appeared to be deeper and more widely distributed. Many setbacks were reversals in the winning markets in April. In FX, long US Dollar vs. G10 (Aussie, CAD, NZD, GBP, EUR) and Asia (ex-Japan), and long USD vs. emerging markets (MXN) posted sizeable losses. Choppy price action in fixed Income markets resulted in setbacks – mostly occurring at the start and end of the month. In commodities, big losses from long energies (crude and refined products), while Nat Gas rallied against short positions; losses in short Ags exposures (soybeans, soymeal, wheat) were punished during short squeezes caused by weather and supply chain disruptions. Softs trading (coffee, cocoa) was generally negative across the programs we follow.
Commodities Specialists – Agricultural Programs
May was a difficult month for discretionary fundamental Ags specialists, particularly for those coming into May with a bearish stance in the soybean complex, wheat, and live cattle markets. There was a building consensus that long-term fundamentals were pointing to oversupply in many of those markets. (In the soy complex specifically, an oversupply for roughly the next 12-18 months.) But near-term weather events and supply dynamics superseded the mid- to longer-term supply and demand dynamics for most of the month. This squeezed short exposures into loss territory, with many managers bailing as they hit stop-loss levels. Straight directional trades (options, futures) appeared to fare worse than relative value spread trades (calendars, inter-commodity ratio trades).
Commodities Specialists – Industrial Programs (Metals & Energy)
May was a difficult month for energy strategies, both fundamental discretionary and model-driven, and across directional and relative value strategies. Energy programs may have gotten the worst of it. Weak demand for crude, leading to falling prices, hurt many programs. And a surprisingly dramatic rally in US natural gas prices, which belied expectations, also resulted in setbacks. Fundamental metals traders had a better go of it. Both precious and industrial metals rallied in May, driven by such fundamental factors as increased Chinese demand, central banks’ continued gold purchases, and demand for energy transition battery metals. A unique circumstance in COMEX’ Copper markets caused a very dramatic shortage of copper - causing prices to skyrocket. This resulted in some managers booking unrealized losses until (or “if”) the COMEX Copper price mean reverts back to historical ratios with other copper markets (ex. LME and Shanghai).
**********
Footnotes
For the “style classes” and “baskets” presented in this letter: The “style baskets” referenced above were created by Kettera for research purposes to track the category and are classifications drawn by Kettera Strategies in their review of programs on and for the Hydra Platform. The arrows represent the style basket’s overall performance for the month (e.g. the sideways arrow indicates that the basket was largely flat overall, a solid red down arrow indicates the basket (on average) was largely negative compared to most months, etc.). The “style basket” for a class is created from monthly returns (net of fees) of programs that are either: programs currently or formerly on Hydra; or under review with an expectation of being added to Hydra. The weighting of a program in a basket depends upon into which of these three groups the program falls. Style baskets are not investible products or index products being offered to investors. They are meant purely for analysis and comparison purposes. These also were not created to stimulate interest in any underlying or associated program. Nonetheless, as these research tools may be regarded to be “hypothetical” combinations of managers, hypothetical performance results have many inherent limitations, some of which are described below. No representation is being made that any product or account will achieve profits or losses similar to those shown. In fact, there are frequently sharp differences between hypothetical performance results and the actual results subsequently achieved by any particular trading program. One of the limitations of hypothetical results is that they are generally prepared with the benefit of hindsight. In addition, hypothetical trading does not involve financial risk, and no hypothetical trading record can completely account for the impact of financial risk in actual trading. There are numerous other factors related to the markets in general or to the implementation of any specific trading program which cannot be fully accounted for in the preparation of hypothetical performance results and all of which can adversely affect actual trading results.
Benchmark sources:
- Blend of Eurekahedge Macro Hedge Fund Index and BarclayHedge Global Macro Index
- The Eurekahedge Macro Index (same link as above)
- The Societe Generale Trend Index
- The Societe Generale Short-term Traders Index (same link as above)
- The BarclayHedge Currency Traders Index
- Blend of Bridge Alternatives Commodity Hedge Fund Index and BarclayHedge Discretionary Traders Index
- The BarclayHedge Agricultural Traders Index
- The Eurekahedge Commodity Hedge Fund Index:
- Blend of CBOE Eurekahedge Relative Value Volatility Hedge Fund Index and CBOE Eurekahedge Long Volatility Index:
- Blend of Eurekahedge Asset Weighted Multi Strategy Asset Weighted Index and BarclayHedge Multi Strategy Index
Indices and other financial benchmarks shown are provided for illustrative purposes only, are unmanaged, reflect reinvestment of income and dividends and do not reflect the impact of advisory fees. Index data is reported as of date of publication and may be a month-to-date estimate if all underlying components have not yet reported. The index providers may update their reported performance from time to time. Kettera disclaims any obligation to verify these numbers or to update or revise the performance numbers.
***
The views expressed in this article are those of the author and do not necessarily reflect the views of AlphaWeek or its publisher, The Sortino Group
© The Sortino Group Ltd
All Rights Reserved. No part of this publication may be reproduced, stored in a retrieval system or transmitted in any form or by any means, electronic, mechanical, photocopying, recording or scanning or otherwise, except under the terms of the Copyright, Designs and Patents Act 1988 or under the terms of a licence issued by the Copyright Licensing Agency or other Reprographic Rights Organisation, without the written permission of the publisher. For more information about reprints from AlphaWeek, click here.