


Kettera Strategies Heat Map - July 2024
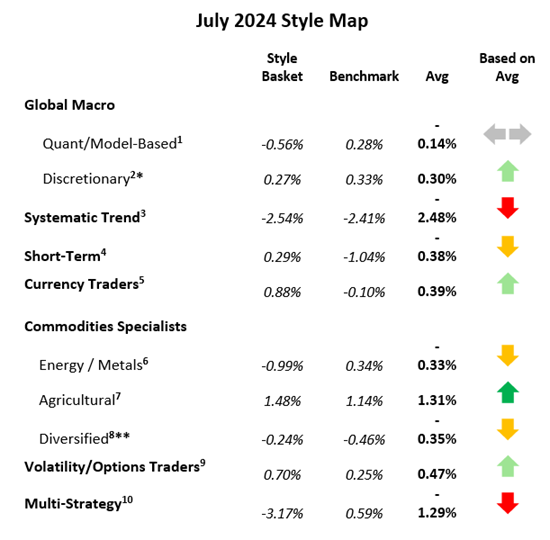
The Style Heat Map (see below) offers a snapshot for the month on all categories of strategies. For the month of June the following summaries highlight five of the 10 style categories that we track.
Currency Specialists
In July the USD’s performance was mixed (generally down vs the majors, up vs the commodities-currencies), while the “risk off” unwinding of the carry trade vaulted the Japanese yen back up to levels not seen since mid-March. All that said, the FX specialists we follow were generally flat to positive on the month. The yen was the main story – and has been a common theme in most of the July newsletters we’ve read. Performance largely depended on how a manager was positioned coming into the month in the yen, and – if short JPY - how quickly it could pivot to the long side. Longer-term systematic (e.g. trend followers) suffered at the hands of the yen, while intraday and short-term systems reaped profits. More fundamentally-driven macro-FX programs we follow were mixed.
Systematic Trend Programs
It was a challenging month for most trend following programs, as July was peppered with surprise developments. Events such as the attempted assassination of former President Trump and President Biden’s departure from the US presidential race helped make this style category the worst performer in July. As financial markets are a staple item for nearly all systematic trend managers, the Japanese yen’s rally of 7% vs.the USD wreaked havoc in July returns. Most systems were short the yen not just against the USD, but also vs the euro and other G10 units. Other positions that were a drag on performance included short fixed income (US treasuries, French OAT, German bunds, etc) as prices rose (rates fell), contrary to the positioning of many medium-term trend systems. Programs with long exposure to the VIX performed a bit better yet still negatively overall.
Discretionary Global Macro Managers
Discretionary global macro was mixed in July, but positively skewed with more winners than losers. Those programs more heavily weighted in fixed income did well on long US and European exposures (yields down) as markets started pricing in aggressive cuts by the Fed and the ECB starting in September. Discretionary macro programs appeared to be mixed in currencies depending on one’s positioning in the Japanese yen which rallied over 7.0% vs. USD, and against most other currencies (British pound, euro, G10) after the Bank of Japan unexpectedly raised rates on July 11. Programs with heavier exposure to commodities generally benefitted with any combination of short exposure to grains, short crude and products, short base metals and long gold.
Commodity Managers – Agricultural Specialists
Agricultural grains and livestock programs performed well in July as longer-term fundamentals were not overridden by short-term phenomena such as storms or temporary supply chain issues. Fundamental discretionary spread/RV strategies (calendars, inter-commodity) and more directional strategies both benefited primarily from short exposure to soybeans and (to a lesser extent) short corn, which were both down on expectations of bountiful harvests and oversupply. Programs trading more heavily in livestock enjoyed gains from long cattle exposures that were somewhat consistently closed by month-end due to changing fundamentals.
Commodity Managers – Metals & Energy Specialists
Industrial commodities programs were mixed, with energy traders more exposed to crude and refined products outperforming the natural gas specialists, and shorter-term metals traders outperforming the longer-term programs. Across the major industrial commodities, only gold was noticeably positive, which means profitable programs were either directionally short or short-biased using spreads. Crude oil was really trending downwards until the last day of the month when some profits were given back after the assassination of a key person in the Middle East. Nat-gas traded down 20% on ample supplies and weaker demand from mild summer temperatures. Nimble metals traders were short copper, nickel and zinc on weak fundamentals and technical internal market structure, while those programs taking the much longer view on base metals underperformed while sitting on long exposures.
Source: Kettera Strategies
Past performance is not necessarily indicative of future results. See notes at end of this document for details on the construction of the Hydra "baskets" and the benchmark used for each style class. Also note that some baskets may contain managers that have not yet reported by this date. *=Less than 75% reported. **=Less than 75% reported and absence of a core manager's return.
**********
Footnotes:
For the “style classes” and “baskets” presented in this letter: The “style baskets” referenced above were created by Kettera for research purposes to track the category and are classifications drawn by Kettera Strategies in their review of programs on and for the Hydra Platform. The arrows represent the style basket’s overall performance for the month (e.g. the sideways arrow indicates that the basket was largely flat overall, a solid red down arrow indicates the basket (on average) was largely negative compared to most months, etc.). The “style basket” for a class is created from monthly returns (net of fees) of programs that are either: programs currently or formerly on Hydra; or under review with an expectation of being added to Hydra. The weighting of a program in a basket depends upon into which of these three groups the program falls. Style baskets are not investible products or index products being offered to investors. They are meant purely for analysis and comparison purposes. These also were not created to stimulate interest in any underlying or associated program. Nonetheless, as these research tools may be regarded to be “hypothetical” combinations of managers, hypothetical performance results have many inherent limitations, some of which are described below. No representation is being made that any product or account will achieve profits or losses similar to those shown. In fact, there are frequently sharp differences between hypothetical performance results and the actual results subsequently achieved by any particular trading program. One of the limitations of hypothetical results is that they are generally prepared with the benefit of hindsight. In addition, hypothetical trading does not involve financial risk, and no hypothetical trading record can completely account for the impact of financial risk in actual trading. There are numerous other factors related to the markets in general or to the implementation of any specific trading program which cannot be fully accounted for in the preparation of hypothetical performance results and all of which can adversely affect actual trading results.
Benchmark sources:
- Blend of Eurekahedge Macro Hedge Fund Index and BarclayHedge Global Macro Index
- The Eurekahedge Macro Index (same link as above)
- The Societe Generale Trend Index
- The Societe Generale Short-term Traders Index (same link as above)
- The BarclayHedge Currency Traders Index
- Blend of Bridge Alternatives Commodity Hedge Fund Index and BarclayHedge Discretionary Traders Index
- The BarclayHedge Agricultural Traders Index
- The Eurekahedge Commodity Hedge Fund Index:
- Blend of CBOE Eurekahedge Relative Value Volatility Hedge Fund Index and CBOE Eurekahedge Long Volatility Index:
- Blend of Eurekahedge Asset Weighted Multi Strategy Asset Weighted Index and BarclayHedge Multi Strategy Index
Indices and other financial benchmarks shown are provided for illustrative purposes only, are unmanaged, reflect reinvestment of income and dividends and do not reflect the impact of advisory fees. Index data is reported as of date of publication and may be a month-to-date estimate if all underlying components have not yet reported. The index providers may update their reported performance from time to time. Kettera disclaims any obligation to verify these numbers or to update or revise the performance numbers.
***
The views expressed in this article are those of the author and do not necessarily reflect the views of AlphaWeek or its publisher, The Sortino Group
© The Sortino Group Ltd
All Rights Reserved. No part of this publication may be reproduced, stored in a retrieval system or transmitted in any form or by any means, electronic, mechanical, photocopying, recording or scanning or otherwise, except under the terms of the Copyright, Designs and Patents Act 1988 or under the terms of a licence issued by the Copyright Licensing Agency or other Reprographic Rights Organisation, without the written permission of the publisher. For more information about reprints from AlphaWeek, click here.