


Kettera Strategies Heat Map - August 2024
The Style Heat Map (see farther below) offers a snapshot for the month on all categories of strategies. For the month of August the following summaries highlight five of the 10 style categories that we track.
Systematic Trend
Long-term trend following programs suffered a difficult August, especially in currencies (long USD got slammed) and energies (long exposures did poorly). It was an eventful month that started with a violent spike in volatility prompted by another unexpected interest rate hike in Japan, triggering an unwind of a highly levered carry trade (short Japanese Yen, long US dollar). The Nikkei dropped 12% on in just one single day (August 5) as investors sold stocks to buy yen, prompting the Japanese currency to rally 7% vs. USD. Such sudden and sharp market reversals can wreak havoc on systematic trend programs. Winning positions included long US and European bonds and rates, as yields dropped throughout the month. Long gold was another profitable exposure. Programs with medium-term holding periods fared better than longer-term strategies, but were still largely negative nevertheless.
Quantitative Global Macro
Quant Macro was mixed in August. The more successful programs were those with more fundamental inputs (as opposed to those with greater reliance on price-based models), and those programs long Fixed Income in Europe and the US – although programs with a focus on relative value fixed income experienced more mixed results. In the equities sector, those quants nimble enough to trade equity indices short in the first half of the month, and long during the second half, fared well, but most managers were mixed in this sector. Programs with more exposure to commodities appeared to outperform those focused more on financials, especially if they held long positions in softs (coffee, cocoa), and shorts in energies (crude, heating oil, gas).
Discretionary Global Macro
Discretionary global macro managers also faced a mixed environment, although the programs we track in our style bucket seemed to fare relatively well. The big macro stories for the month were the yen unwind at the start of the month (thanks to the sudden rate hike in Japan) and then later the U.S. Federal Reserve changing its tune on interest rates. This gave rise to opportunities in the fixed income and currency markets for those discretionary managers that read the tea leaves right. Obviously, those managers positioned long G10 bond markets coming into the month would have fared well, but we note that macro funds heavily reliant on fixed income themes encountered underperformance in general – at least relative to more diversified or agile managers (e.g. those active in currencies and commodities). Managers anticipating quicker or deeper rate cuts in the U.S – even if they called the bearish USD right - also faced disappointment. On the other hand, pre-existing long positions in the USD (or short the yen) faced setbacks we losing propositions. It seems the programs that did well capitalized on divergences in global interest rates, stable inflation expectations, and weren’t bridled by expectations for a strong US dollar.
Commodity Specialists – Agricultural Markets
Grains and livestock programs were mixed and slightly positive overall, with positive performers outweighing negative ones. August had a split personality, where grains markets initially pushed down toward new lows in the first half of the month (largely on good weather conditions, expectations of record crop yields, and increased competition from South America). Most discretionary programs held directional short and/or short-biased calendar spreads to both corn and soybeans. Late in the month, soybean and corn futures rallied on adverse dry and hot weather affecting yield potential, where money management short-covering helped to fuel the rally. Programs with a greater allocation to short positions in the cattle and beef markets outperformed.
Currency Specialists
Returns of FX specialists were mixed in August. While industry benchmarks were positive in August, the programs that comprise the Hydra style bucket were negative. Currency markets began the month turbulently as an unexpected rate hike by the Bank of Japan on July 31 led to a violent carry-trade unwind between Japanese yen and US dollar. Several large managers themselves on the wrong side of positions during the unwind, which appeared to catch many interest rate- and econometric-focused programs off guard. (The yen rallied 7% vs. USD in the first three trading days.) The USD weakened vs. most G10 currencies, while appreciating vs. emerging markets during the “risk-off” turmoil. Quicker strategies were nimble enough to navigate the fast-moving markets profitably, while slower-moving programs, especially those using fundamental econometric inputs (inherently slow-moving), did poorly. The second half of August presented limited opportunities as volatility quickly compressed and trading ranges returned to normal.
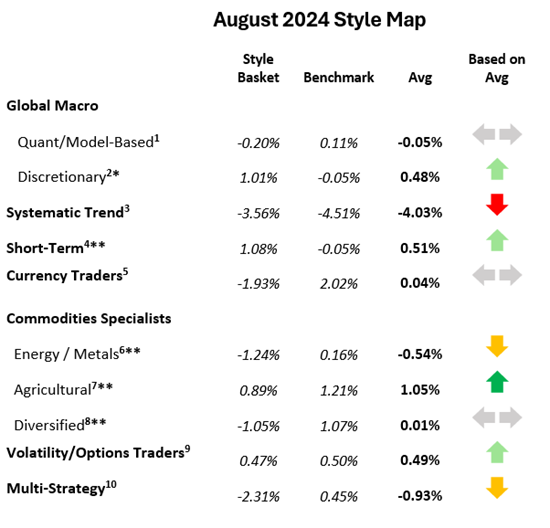
Past performance is not necessarily indicative of future results. See notes at end of this document for details on the construction of the Hydra "baskets" and the benchmark used for each style class. Also note that some baskets may contain managers that have not yet reported by this date. *=Less than 75% reported. **=Less than 75% reported and absence of a core manager's return.
**********
Footnotes:
For the “style classes” and “baskets” presented in this letter: The “style baskets” referenced above were created by Kettera for research purposes to track the category and are classifications drawn by Kettera Strategies in their review of programs on and for the Hydra Platform. The arrows represent the style basket’s overall performance for the month (e.g. the sideways arrow indicates that the basket was largely flat overall, a solid red down arrow indicates the basket (on average) was largely negative compared to most months, etc.). The “style basket” for a class is created from monthly returns (net of fees) of programs that are either: programs currently or formerly on Hydra; or under review with an expectation of being added to Hydra. The weighting of a program in a basket depends upon into which of these three groups the program falls. Style baskets are not investible products or index products being offered to investors. They are meant purely for analysis and comparison purposes. These also were not created to stimulate interest in any underlying or associated program. Nonetheless, as these research tools may be regarded to be “hypothetical” combinations of managers, hypothetical performance results have many inherent limitations, some of which are described below. No representation is being made that any product or account will achieve profits or losses similar to those shown. In fact, there are frequently sharp differences between hypothetical performance results and the actual results subsequently achieved by any particular trading program. One of the limitations of hypothetical results is that they are generally prepared with the benefit of hindsight. In addition, hypothetical trading does not involve financial risk, and no hypothetical trading record can completely account for the impact of financial risk in actual trading. There are numerous other factors related to the markets in general or to the implementation of any specific trading program which cannot be fully accounted for in the preparation of hypothetical performance results and all of which can adversely affect actual trading results.
Benchmark sources:
- Blend of Eurekahedge Macro Hedge Fund Index and BarclayHedge Global Macro Index
- The Eurekahedge Macro Index (same link as above)
- The Societe Generale Trend Index
- The Societe Generale Short-term Traders Index (same link as above)
- The BarclayHedge Currency Traders Index
- Blend of Bridge Alternatives Commodity Hedge Fund Index and BarclayHedge Discretionary Traders Index
- The BarclayHedge Agricultural Traders Index
- The Eurekahedge Commodity Hedge Fund Index:
- Blend of CBOE Eurekahedge Relative Value Volatility Hedge Fund Index and CBOE Eurekahedge Long Volatility Index:
- Blend of Eurekahedge Asset Weighted Multi Strategy Asset Weighted Index and BarclayHedge Multi Strategy Index
Indices and other financial benchmarks shown are provided for illustrative purposes only, are unmanaged, reflect reinvestment of income and dividends and do not reflect the impact of advisory fees. Index data is reported as of date of publication and may be a month-to-date estimate if all underlying components have not yet reported. The index providers may update their reported performance from time to time. Kettera disclaims any obligation to verify these numbers or to update or revise the performance numbers.
***
The views expressed in this article are those of the author and do not necessarily reflect the views of AlphaWeek or its publisher, The Sortino Group
© The Sortino Group Ltd
All Rights Reserved. No part of this publication may be reproduced, stored in a retrieval system or transmitted in any form or by any means, electronic, mechanical, photocopying, recording or scanning or otherwise, except under the terms of the Copyright, Designs and Patents Act 1988 or under the terms of a licence issued by the Copyright Licensing Agency or other Reprographic Rights Organisation, without the written permission of the publisher. For more information about reprints from AlphaWeek, click here.