

Kettera Strategies Heatmap - June 2020
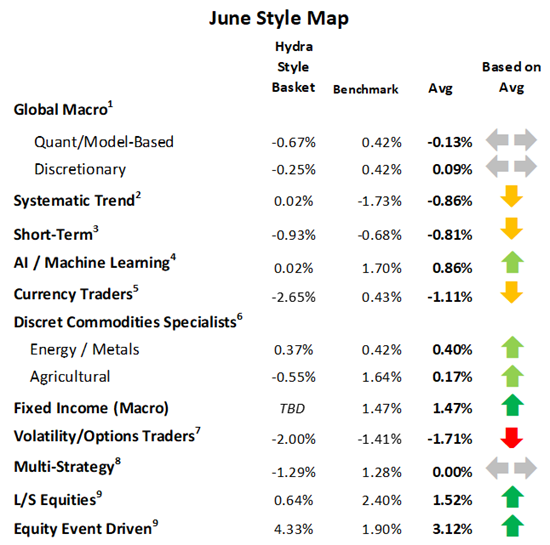
In contrast to their Quant brethren (below), many discretionary macro managers stuck to their skepticism on the recent equities rally, as well as the expectation that the USD would strengthen. The question in June for this type of manager was when to stick to macroeconomic principles versus when to respect market momentum and sentiment. For quant macro, the more profitable sectors were not unlike those for systematic trend programs: Equities indices and (to a lesser extent) fixed income, while FX was the biggest disappointment. Relative value models (at least in fixed income) seemed to work well during the month, but behavioral and econometric models for most of these managers faced setbacks.
Systematic Trend Programs had a mixed to slightly negative on average June. The best sectors were equities indices, followed closely by fixed income. The most challenging markets were FX, short energies, and short ag commodities. This whipsaw environment developed as markets seemed to be caught in a tug-of-war between concerns about new virus outbreaks in the U.S. on one end and massive monetary and fiscal stimulus on the other.
For Short-Term traders, generally speaking, June was not a lucrative month for most intraday and short-term trading programs. “Range breakout” types of systems appeared to be the most challenged, as sharp moves away from the short-term range in most financial markets seemed to be consistently met with abrupt reversions.
With some notable exceptions, most of the FX programs we follow had setbacks in June. Most USD-based exchange rates and rates among the “big four” currencies were largely range-bound with lowered volatility. While commodities-based and emerging market currencies appeared to offer more opportunities, most programs that profited from these exchange rates were countered by losses in the majors.
After solid performance in April and May for equity long-short managers, June seemed to be a “give back” month for many L-S equity generalists - primarily the first half of the month. This was largely attributable to the choppy inconsistent moves in equities generally worldwide. But results depended on a manager’s net long vs short tilt, sector concentration, and leverage. For those managers that positioned their portfolios – either long or short – based on quality were disrupted by technicals and sentiment. Long trades in tech stocks appeared to benefit the most, while financial companies detracted the most.
**********
For the “style classes” and “baskets” presented in this letter: The “style baskets” referenced above were created by Kettera for research purposes to track the category and are classifications drawn by Kettera Strategies in their review of programs on and for the Hydra Platform. The arrows represent the style basket’s overall performance for the month (e.g. the sideways arrow indicates that the basket was largely flat overall, a solid red down arrow indicates the basket (on average) was largely negative compared to most months, etc.). The “style basket” for a class is created from monthly returns (net of fees) of programs that are either: programs currently or formerly on Hydra; or under review with an expectation of being added to Hydra. The weighting of a program in a basket depends upon into which of these three groups the program falls. Style baskets are not investible products or index products being offered to investors. They are meant purely for analysis and comparison purposes. These also were not created to stimulate interest in any underlying or associated program. Nonetheless, as these research tools may be regarded to be “hypothetical” combinations of managers, hypothetical performance results have many inherent limitations, some of which are described below. No representation is being made that any product or account will achieve profits or losses similar to those shown. In fact, there are frequently sharp differences between hypothetical performance results and the actual results subsequently achieved by any particular trading program. One of the limitations of hypothetical results is that they are generally prepared with the benefit of hindsight. In addition, hypothetical trading does not involve financial risk, and no hypothetical trading record can completely account for the impact of financial risk in actual trading. There are numerous other factors related to the markets in general or to the implementation of any specific trading program which cannot be fully accounted for in the preparation of hypothetical performance results and all of which can adversely affect actual trading results.
Benchmark sources:
1-The Hedge Fund Intelligence Global Macro Index and HFI Currency Index
2-The Societe Generale Trend Index and SG CTA Index
3-The Societe General Short-term Traders Index: (same link as above)
4-The Eurekahedge AI Hedge Fund Index
5-The BarclayHedge Currency Traders Index and BTOP FX Traders Index
6- S&P GSCI Metals & Energy Index and S&P GSCI Ag Commodities Index
7-The CBOE Eurekahedge Relative Value Volatility Hedge Fund Index
8-The Eurekahedge-Mizuho Multi-Strategy Index: (See above)
9-The Eurekahedge Long Short Equities Hedge Fund Index: (See above)
10-Blend of BarclayHedge Equity Market Neutral Index with Eurekahedge Equity Mkt Neutral Index (see link above)
Indices and other financial benchmarks shown are provided for illustrative purposes only, are unmanaged, reflect reinvestment of income and dividends and do not reflect the impact of advisory fees. Index data is reported as of date of publication and may be a month-to-date estimate if all underlying components have not yet reported. The index providers may update their reported performance from time to time. Kettera disclaims any obligation to verify these numbers or to update or revise the performance numbers.
***
The views expressed in this article are those of the author and do not necessarily reflect the views of AlphaWeek or its publisher, The Sortino Group
© The Sortino Group Ltd
All Rights Reserved. No part of this publication may be reproduced, stored in a retrieval system or transmitted in any form or by any means, electronic, mechanical, photocopying, recording or scanning or otherwise, except under the terms of the Copyright, Designs and Patents Act 1988 or under the terms of a licence issued by the Copyright Licensing Agency or other Reprographic Rights Organisation, without the written permission of the publisher. For more information about reprints from AlphaWeek, click here.