


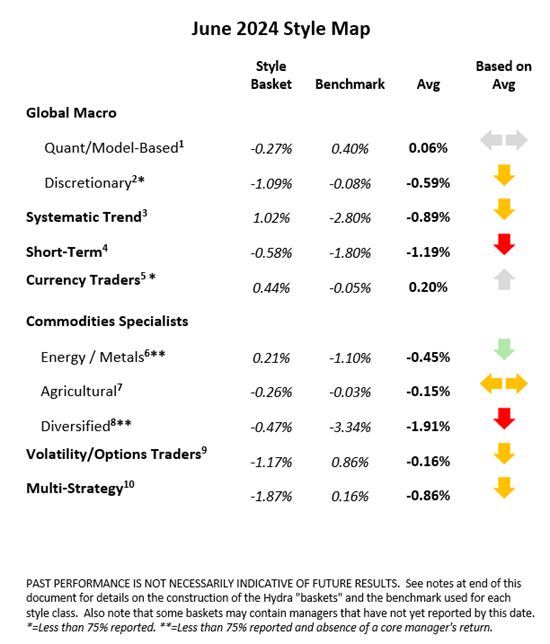
Kettera Strategies Heat Map - June 2024
The Style Heat Map below offers a snapshot for the month on all categories of strategies. For the month of June the following summaries highlight six of the 10 style categories that we track.
Systematic Trend Programs
Longer-term trend programs finished the month mixed, although with more negatives than positives - pulling this strategy bucket down into negative territory. (We note, however, that most of the systematic trend managers listed on Hydra summed to a net positive.) The most challenging sector was fixed income/interest rates, where rallies (yields lower) in Europe, the UK, and the US reversed longstanding short positions. Currencies were mostly positive and often the best performing sector as the US Dollar rallied against most other currencies; short Japanese Yen vs. USD was one of the best performing positions. Programs with heavier exposures to commodities fared better than others, with long crude oil and short grains (corn, soybeans, wheat) positions performing well. Long exposures in precious and base metals were punished and offset some of the aforementioned gains in commodities. Equities indices were mixed as long exposures in the US were rewarded while longs in Europe were hurt by sell-offs after the French elections. Longer vs medium vs shorter holding periods did not appear to matter much in June, as the profitability of the systems had more to do with sector allocation and less to do with trade horizons.
Global Macro Managers
The majority of the discretionary global macro programs we track appeared to be negative in June – but for a variety of reasons. The primary theme of many programs was a version of US yield curve steepening, where positioning is long the front end (expecting short term interest rates to drop) and long the back end (expecting longer term bond rates to rise relative to front). This trade was unprofitable in June, but it is a longer-term macro view that traders emphasize takes time to develop. For those macro managers trading commodities, most programs came into the month either long or flat the metals markets. But sell-offs in precious metals (gold, silver, platinum) and base metals (copper, aluminum, nickel) put a big dent in performance, as global demand for both the precious and industrial subsectors was weak. Although we note that those programs long the emerging market currencies (most notably Mexico and Brazil) versus USD suffered setbacks, most macro managers profited on a continuing short Japanese Yen exposure vs. other G10 units. Results in global equities and energy markets were mixed.
Commodities Managers – Agricultural Specialists
The ag commodities groups that we follow are comprised of mostly discretionary fundamental grains, softs and livestock traders along with a handful of systematic programs. All appeared to end up with mixed results in June – which proved to be a very tricky month. A frenzied mix of contradictory fundamental factors - including weather forecasts, planted acreage, crop yields, expected crop substitution, export demand, and farmer selling or lack thereof - made positioning difficult. And this was the case for traders of both directional as well as RV/spread strategies. The case could be made for either long or short positioning early in the month, but in the end only the shorts prevailed: Corn, soybeans and wheat all sold off with the downward trajectory, a slide that increased late in the month. The price-based models of systematic programs seemed to fare a bit better, as they were generally positioned short these markets. The livestock sector did not seem to offer much of a better story – for either fundamental or systematic programs - as short-term disruptions upended longer-term, more fundamentally sound outlooks. In the soft commodities, the only notable profitable position we tracked appeared to be long exposures in sugar.
Commodities Managers – Industrial Programs (Metals & Energy)
June was also very mixed for specialists in the industrial commodities sector, although returns seemed to be more consistent and better on the whole vs their ag trading brethren. Many energy—focused managers were fortunate enough to catch rising prices in crude (WTI, Brent) and refined products (heating oil, gasoil, unleaded gasoline). These programs held a long bias due to tight supply, diminishing inventories, and the onset of summer and extreme heat. Metals specialists, on the other hand, did not do well in June given weak global demand for precious and base metals (most notably copper). A small subset of this category, power (electricity) traders, faced serious challenges – where some of the programs that we follow posted some of their worst months in years.
FX Programs
As the US dollar rallied against most currencies in June - both G10 and emerging market units – the currency trading community appeared to be largely sideways to slightly positive. Programs taking a longer view were able to ignore most of the short-term choppiness and hold tight to profitable positions. Shorter-term directional strategies suffered during the very choppy first half of the month, clawing back a portion of the losses during the smoother second half when trends resumed. The Japanese yen continued to weaken against the USD reaching 160/$USD, an exchange rate not seen since the mid-1980s. This was the most profitable exposure for many FX groups. Political factors also affected a couple of notable currency pairs, as unexpected election results in France weakened the euro, while the election in Mexico saw the peso sell off dramatically against the USD.
**********
Footnotes:
For the “style classes” and “baskets” presented in this letter: The “style baskets” referenced above were created by Kettera for research purposes to track the category and are classifications drawn by Kettera Strategies in their review of programs on and for the Hydra Platform. The arrows represent the style basket’s overall performance for the month (e.g. the sideways arrow indicates that the basket was largely flat overall, a solid red down arrow indicates the basket (on average) was largely negative compared to most months, etc.). The “style basket” for a class is created from monthly returns (net of fees) of programs that are either: programs currently or formerly on Hydra; or under review with an expectation of being added to Hydra. The weighting of a program in a basket depends upon into which of these three groups the program falls. Style baskets are not investible products or index products being offered to investors. They are meant purely for analysis and comparison purposes. These also were not created to stimulate interest in any underlying or associated program. Nonetheless, as these research tools may be regarded to be “hypothetical” combinations of managers, hypothetical performance results have many inherent limitations, some of which are described below. No representation is being made that any product or account will achieve profits or losses similar to those shown. In fact, there are frequently sharp differences between hypothetical performance results and the actual results subsequently achieved by any particular trading program. One of the limitations of hypothetical results is that they are generally prepared with the benefit of hindsight. In addition, hypothetical trading does not involve financial risk, and no hypothetical trading record can completely account for the impact of financial risk in actual trading. There are numerous other factors related to the markets in general or to the implementation of any specific trading program which cannot be fully accounted for in the preparation of hypothetical performance results and all of which can adversely affect actual trading results.
Benchmark sources:
- Blend of Eurekahedge Macro Hedge Fund Index and BarclayHedge Global Macro Index
- The Eurekahedge Macro Index (same link as above)
- The Societe Generale Trend Index
- The Societe Generale Short-term Traders Index (same link as above)
- The BarclayHedge Currency Traders Index
- Blend of Bridge Alternatives Commodity Hedge Fund Index and BarclayHedge Discretionary Traders Index
- The BarclayHedge Agricultural Traders Index
- The Eurekahedge Commodity Hedge Fund Index:
- Blend of CBOE Eurekahedge Relative Value Volatility Hedge Fund Index and CBOE Eurekahedge Long Volatility Index:
- Blend of Eurekahedge Asset Weighted Multi Strategy Asset Weighted Index and BarclayHedge Multi Strategy Index
Indices and other financial benchmarks shown are provided for illustrative purposes only, are unmanaged, reflect reinvestment of income and dividends and do not reflect the impact of advisory fees. Index data is reported as of date of publication and may be a month-to-date estimate if all underlying components have not yet reported. The index providers may update their reported performance from time to time. Kettera disclaims any obligation to verify these numbers or to update or revise the performance numbers.
***
The views expressed in this article are those of the author and do not necessarily reflect the views of AlphaWeek or its publisher, The Sortino Group
© The Sortino Group Ltd
All Rights Reserved. No part of this publication may be reproduced, stored in a retrieval system or transmitted in any form or by any means, electronic, mechanical, photocopying, recording or scanning or otherwise, except under the terms of the Copyright, Designs and Patents Act 1988 or under the terms of a licence issued by the Copyright Licensing Agency or other Reprographic Rights Organisation, without the written permission of the publisher. For more information about reprints from AlphaWeek, click here.